Introducing JumpeR - For Track and Field Data
Ordinarily posts on Swimming + Data Science have focused on swimming, or sometimes diving. Today though we’re going to visit some of our more gravity-afflicted colleagues and do a bit of cross-training. That’s because following what I’m going to call the SwimmeR package’s massive success literally several people reached out to me regarding developing a similar package for track and field. That package, called JumpeR, is now available on CRAN.
Please not this post was updated to reflect changes contained in JumpeR v0.3.0 released November 2021
You can get your very own copy of this cutting edge sports-data-science package, for free, today!
install.packages("JumpeR")library(JumpeR)
library(flextable)
library(dplyr)
library(ggplot2)
flextable_style <- function(x) {
x %>%
flextable() %>%
bold(part = "header") %>% # bolds header
bg(bg = "#D3D3D3", part = "header") %>% # puts gray background behind the header row
autofit()
}What does JumpeR do?
JumpeR is very similar to SwimmeR. They both mostly serve to convert results from human readable documents to machine & human readable data frames in the context of the R programming environment.
Supported Results Format
JumpeR currently supports single column Hy-Tek results, like these, and Flash Results .pdf files like these. JumpeR does not support multi-column Hy-Tek results or Flash .html files. Further details are available in the package readme file.
Examples
A Running Race
Here’s an example, reading in the 2019 Ivy League Championships and looking at the finals of the Women’s 200M Dash
df <- tf_parse(
  read_results("http://www.leonetiming.com/2020/Indoor/IvyLeague/Results.htm")
  )

df %>%
  filter(Event == "Women 200 Meter Dash") %>%
  group_by(Name, Team) %>% # to remove prelims
  slice(2) %>% # to remove prelims
  arrange(Place) %>% # arrange by Place
flextable_style()Place | Name | Age | Team | Finals_Result | Tiebreaker | DQ | Event |
1 | Katina Martin | SO | Harvard | 24.05 | 0 | Women 200 Meter Dash | |
2 | Olivia Okoli | JR | Harvard | 24.44 | 0 | Women 200 Meter Dash | |
3 | Cecil Ene | SR | Penn | 24.52 | 24.511 | 0 | Women 200 Meter Dash |
4 | Elena Brown-Soler | SR | Penn | 24.52 | 24.520 | 0 | Women 200 Meter Dash |
5 | Katie DiFrancesco | JR | Princeton | 24.53 | 0 | Women 200 Meter Dash | |
6 | Libby McMahon | SO | Yale | 25.12 | 0 | Women 200 Meter Dash | |
7 | Isabella Hilditch | SO | Princeton | 40.06 | 0 | Women 200 Meter Dash | |
Kennedy Waite | FR | Brown | DNF | 1 | Women 200 Meter Dash |
Discus, with Flights
But wait, there’s more! Field events, like jumping and throwing, allow athletes to try several times, with each try called a “round”. Rounds can be captured as well. Here’s the Men’s Discus from the 2019 Virginia Grand Prix
df <- tf_parse(
  read_results("https://www.flashresults.com/2019_Meets/Outdoor/04-27_VirginiaGrandPrix/038-1.pdf"),
  rounds = TRUE
  )

df %>%
flextable_style()Place | Name | Age | Team | Finals_Result | DQ | Event | Round_1 | Round_2 | Round_3 | Round_4 | Round_5 | Round_6 | Event_Date |
1 | Nicholas EDWARDS | FR | HAMPTON | 49.86m | 0 | Men Discus | X | 47.11 | 45.99 | 47.28 | X | 49.86 | 2019-04-27 |
2 | Michael ALBERT | JR | APP STATE | 48.30m | 0 | Men Discus | 48.30 | 47.16 | 44.96 | X | 45.85 | X | 2019-04-27 |
3 | Joshua HUNTER | SO | HAMPTON | 47.43m | 0 | Men Discus | 31.94 | X | 46.54 | X | 47.43 | X | 2019-04-27 |
4 | Peter KENN | SR | APP STATE | 46.14m | 0 | Men Discus | X | 42.83 | 46.14 | 44.26 | 43.80 | 44.66 | 2019-04-27 |
5 | Asher PRINCE | FR | CHARLOTTE | 45.98m | 0 | Men Discus | X | 45.98 | 44.62 | X | X | X | 2019-04-27 |
6 | Sasha DAJIA | SR | CHARLOTTE | 44.40m | 0 | Men Discus | X | 44.40 | 44.19 | X | 44.08 | 42.04 | 2019-04-27 |
7 | Britton MANN | SR | HIGH POINT | 42.07m | 0 | Men Discus | X | 38.31 | X | 40.49 | X | 42.07 | 2019-04-27 |
8 | Gabriel STAINBACK | SO | HIGH POINT | 39.37m | 0 | Men Discus | 38.53 | 36.94 | 39.37 | – | – | – | 2019-04-27 |
FOUL | Kysheen MYRICK | SO | LIBERTY | FOUL | 1 | Men Discus | X | X | X | 2019-04-27 | |||
FOUL | Tyson JONES | FR | VIRGINIA TECH | FOUL | 1 | Men Discus | X | X | X | 2019-04-27 |
Pole Vault, with Rounds and Attempts
JumpeR can even capture attempts for vertical jumping events, like in these Women’s Pole Vault results from the 2019 Texas A&M Invite. These results do get quite wide, so here they’re cut off at Flight 2.
df <- tf_parse(
  read_results("https://www.flashresults.com/2019_Meets/Outdoor/04-12_TamuInvite/014-1.pdf"),
  rounds = TRUE,
  round_attempts = TRUE
  )

df %>%
  select(Place:Round_2_Attempts) %>%
flextable_style()Place | Name | Age | Team | Finals_Result | DQ | Event | Round_1 | Round_1_Attempts | Round_2 | Round_2_Attempts |
1 | Caroline BELLOWS | SR | UTSA | 3.88m | 0 | Women Pole Vault | 3.28 | --- | 3.43 | O |
2 | Myka STEINBEISSER | FR | ARIZONA STATE | 3.73m | 0 | Women Pole Vault | 3.28 | --- | 3.43 | O |
3 | Tommi HINTNAUS | SO | ARIZONA STATE | 3.73m | 0 | Women Pole Vault | 3.28 | --- | 3.43 | --- |
4 | Erika WILLIS | FR | AIR FORCE | 3.58m | 0 | Women Pole Vault | 3.28 | --- | 3.43 | O |
5 | Kylie SWIEKATOWSKI | JR | RICE | 3.58m | 0 | Women Pole Vault | 3.28 | --- | 3.43 | XO |
6 | Cameron BOEDEKER | JR | SAM HOUSTON ST. | 3.58m | 0 | Women Pole Vault | 3.28 | --- | 3.43 | O |
6 | Kendahl SHUE | JR | TCU | 3.58m | 0 | Women Pole Vault | 3.28 | --- | 3.43 | --- |
8 | Corey FRIEDENBACH | FR | AIR FORCE | 3.58m | 0 | Women Pole Vault | 3.28 | --- | 3.43 | O |
9 | Tysen TOWNSEND | FR | TCU | 3.58m | 0 | Women Pole Vault | 3.28 | --- | 3.43 | XXO |
10 | Lauren LABAY | JR | SAM HOUSTON ST. | 3.43m | 0 | Women Pole Vault | 3.28 | --- | 3.43 | O |
10 | Margaret LASSALLE | SR | SAM HOUSTON ST. | 3.43m | 0 | Women Pole Vault | 3.28 | --- | 3.43 | O |
12 | Emily HARRISON | FR | RICE | 3.43m | 0 | Women Pole Vault | 3.28 | --- | 3.43 | XXO |
12 | Frankie PORAMBO | FR | AIR FORCE | 3.43m | 0 | Women Pole Vault | 3.28 | O | 3.43 | XXO |
DNS | Alexandria GRAY | FR | UTSA | DNS | 0 | Women Pole Vault | 3.28 | 3.43 | ||
NH | Hannah SEARBY | SO | TEXAS A&M | NH | 1 | Women Pole Vault | 3.28 | --- | 3.43 | XXX |
NH | Jerni SELF | SR | AIR FORCE | NH | 1 | Women Pole Vault | 3.28 | --- | 3.43 | --- |
NH | Kathryn TOMCZAK | SR | AIR FORCE | NH | 1 | Women Pole Vault | 3.28 | --- | 3.43 | --- |
Pole Vault Long Format
These results do get quite wide, but don’t worry. Switching to longer is easy as with JumpeR::attempts_split_long.
df <- tf_parse(
  read_results("https://www.flashresults.com/2019_Meets/Outdoor/04-12_TamuInvite/014-1.pdf"),
  rounds = TRUE,
  round_attempts = TRUE
  )


df %>%
  attempts_split_long() %>%
  filter(Place == 1) %>% # only first place athlete
  select(Place, Name, Age, Team, Finals_Result, Event, Bar_Height, Attempt, Result) %>%
flextable_style()Place | Name | Age | Team | Finals_Result | Event | Bar_Height | Attempt | Result |
1 | Caroline BELLOWS | SR | UTSA | 3.88m | Women Pole Vault | 3.28 | 1 | - |
1 | Caroline BELLOWS | SR | UTSA | 3.88m | Women Pole Vault | 3.28 | 2 | - |
1 | Caroline BELLOWS | SR | UTSA | 3.88m | Women Pole Vault | 3.28 | 3 | - |
1 | Caroline BELLOWS | SR | UTSA | 3.88m | Women Pole Vault | 3.43 | 1 | O |
1 | Caroline BELLOWS | SR | UTSA | 3.88m | Women Pole Vault | 3.58 | 1 | X |
1 | Caroline BELLOWS | SR | UTSA | 3.88m | Women Pole Vault | 3.58 | 2 | O |
1 | Caroline BELLOWS | SR | UTSA | 3.88m | Women Pole Vault | 3.73 | 1 | X |
1 | Caroline BELLOWS | SR | UTSA | 3.88m | Women Pole Vault | 3.73 | 2 | O |
1 | Caroline BELLOWS | SR | UTSA | 3.88m | Women Pole Vault | 3.88 | 1 | X |
1 | Caroline BELLOWS | SR | UTSA | 3.88m | Women Pole Vault | 3.88 | 2 | O |
1 | Caroline BELLOWS | SR | UTSA | 3.88m | Women Pole Vault | 4.03 | 1 | X |
1 | Caroline BELLOWS | SR | UTSA | 3.88m | Women Pole Vault | 4.03 | 2 | X |
1 | Caroline BELLOWS | SR | UTSA | 3.88m | Women Pole Vault | 4.03 | 3 | X |
Relay Athletes
Going back to those Ivy League results, we can pull out the names relay athletes for each relay.
df <- tf_parse(
  read_results("http://www.leonetiming.com/2020/Indoor/IvyLeague/Results.htm"),
  relay_athletes = TRUE
  )

df %>%
  filter(Event == "Men 4x400 Meter Relay") %>%
  select(-Tiebreaker, -Name) %>%
flextable_style()Place | Age | Team | Finals_Result | DQ | Event | Relay_Athlete_1 | Relay_Athlete_2 | Relay_Athlete_3 | Relay_Athlete_4 |
1 | Harvard | 3:13.85 | 0 | Men 4x400 Meter Relay | Aaron Shirley | Gregory Lapit | Charles Lego | Jovahn Williamson | |
2 | Penn | 3:15.55 | 0 | Men 4x400 Meter Relay | Robbie Ruppel | Anthony Okolo | Emerson Douds | Antaures Jackson | |
3 | Yale | 3:16.60 | 0 | Men 4x400 Meter Relay | Christopher Colbert | Juma Sei | Phil Zuccaro | Marcus Woods | |
4 | Cornell | 3:17.61 | 0 | Men 4x400 Meter Relay | Christian Martin | Myles Solan | Malick Diomande | Tien Henderson | |
5 | Dartmouth | 3:17.66 | 0 | Men 4x400 Meter Relay | Mathieu Farber | Charlie Wade | Julian Martelly | Max Frye | |
6 | Columbia | 3:19.42 | 0 | Men 4x400 Meter Relay | Chris Balthazar | Jahi Hernandez | Brodie Holmes | Vasilis Kopanas | |
7 | Princeton | 3:20.61 | 0 | Men 4x400 Meter Relay | Gregory Sholars | Klaudio Gjetja | Anderson Dimon | Michael Phillippy | |
8 | Brown | 3:25.72 | 0 | Men 4x400 Meter Relay | Sergey Gorban | Austin Reynolds | Kevin Boyce | Tim McDonough |
Formating Results
Track and field results are of two forms. Times, as “MM:SS.HH”, and lengths/heights, often as “X.XXm”. JumpeR has math_format for converting these result strings into numerics, which is useful when doing comparisons and plotting. Here’s the men’s pole vault at the USA T&F 2019 Championships .
df <- tf_parse(
  read_results("https://www.flashresults.com/2019_Meets/Outdoor/07-25_USATF_CIS/026-1.pdf"))


df %>%
  mutate(Finals_Math = math_format(Finals_Result)) %>% # results to numerics
  mutate(Name = factor(Name, unique(Name))) %>% # order names by order of finish
  ggplot(aes(x = Name, y = Finals_Math)) +
  geom_col() +
  theme_bw() +
  theme(axis.text.x = element_text(
    angle = 90,
    vjust = 0.5,
    hjust = 1
  )) +
  labs(y = "Height Cleared (m)",
       title = "USA Pole Vault Championships")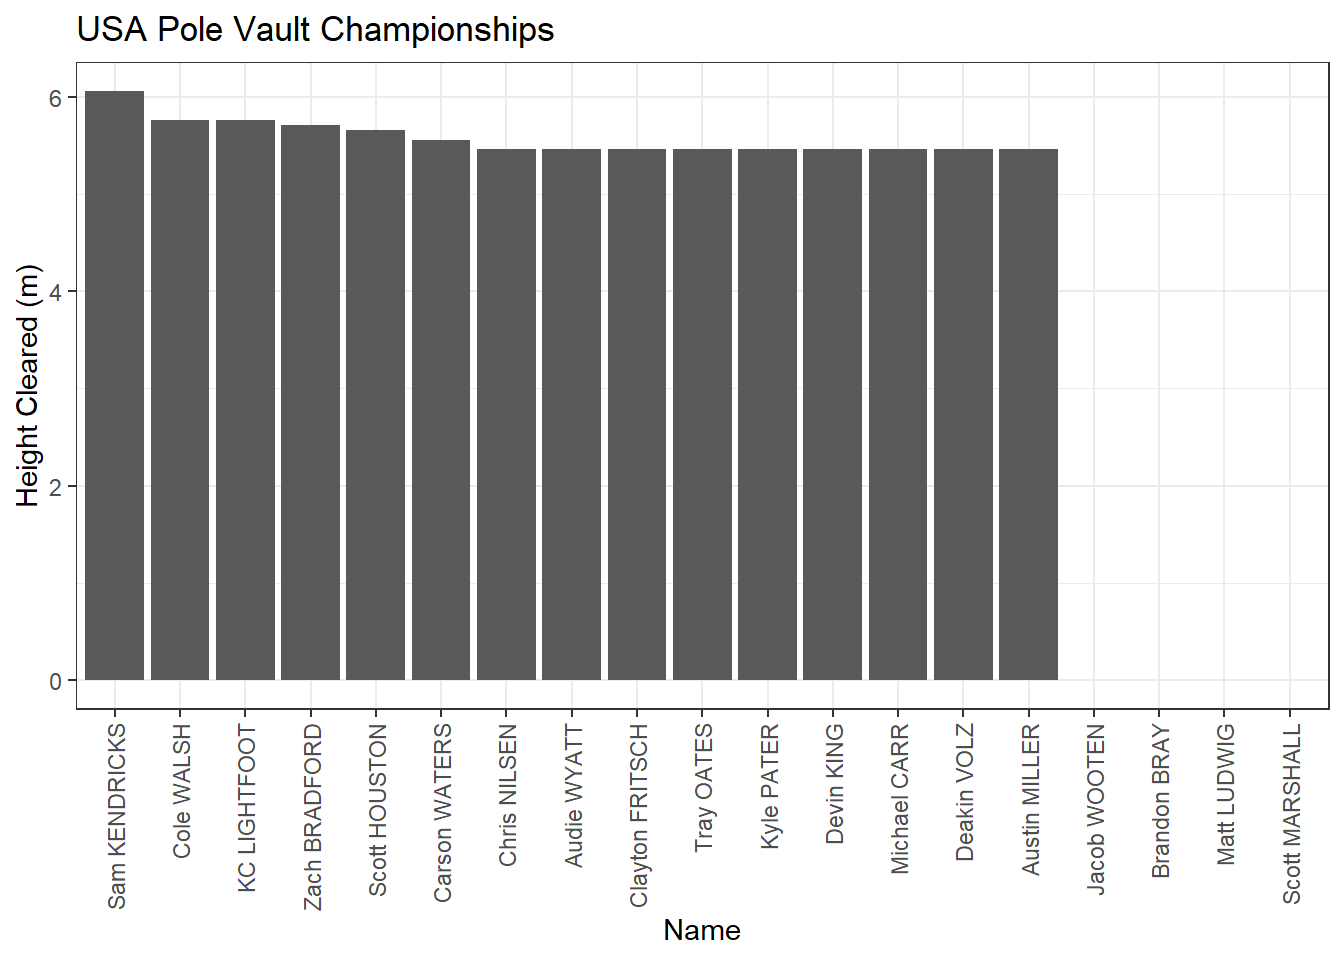
One can use math_format on mixed format lists too. Times will be converted to seconds, meters will remain in meters, and standard units (feet, inches) will be converted to inches. Units however are not included, so be aware.
demo_list <- c(
  "1.23m", # a height/length in meters, output in meters
  "5-06.45", # a height/length in standard, output in inches
  "10:34.34", # a time with minutes, output in seconds
  "9.45" # a time without minutes, output in seconds
)

math_format(demo_list)
## [1] 1.23 66.45 634.34 9.45JumpeR Going Forward
I plan to maintain JumpeR, fix bugs, and respond to feature requests as I’m able. Another useful improvement would be increasing the number/types of supported results. More contributors are certainly welcome. If you’d like to be involved get in touch, or visit the project repo on github.
Updated: 17 November, 2021
Created: 23 February, 2021