Announcing the Swimming + Data Science High School States Swimming State-Off!
The spring and summer of 2020 were going to be exciting times here at Swimming + Data Science, with NCAA championships, Olympic trials, and then the big one, the Olympics, on the docket. That’s all been canceled or postponed though, and with good reason. It has also left me with a few holes in my schedule, so without those meets I’ve decided to make my own virtual meet - from lemons, lemonade!
I’m going to take the high school state championship results from each of the 8 most populous states, boys and girls, and score them against each other in a single elimination tournament. The winner will be grand champion of the inaugural Swimming + Data Science High School Swimming State-Off!
The State-Off, and the resulting series of posts, will serve a few purposes. First, and foremost, to keep me entertained because I can’t actually swim and/or watch swimming. Second, to settle a disagreement between some old college teammates of mine as to whose home state would “dominate” the others in high school swimming. Third, to show off what my SwimmeR package can do, and celebrate the launch of version 0.3.1, and last, to inform, educate, and you know, whatever, Swimming + Data Science style.
This kind of thing must of course be handled seriously, everyone knows nothing makes a sporting event more serious than a bracket. To begin filling a bracket out we need to know teams and seeds. There will be 8 states (teams) in the State-Off, but which 8, and with what seeding?
The United States Census Bureau keeps population data for all US States and territories, including estimates for non-census years like 2019. That data can be collected directly from census.gov. Let’s load some packages and get going!
library(readr)
library(dplyr)
library(flextable)

pop_data <- read_csv("http://www2.census.gov/programs-surveys/popest/datasets/2010-2019/national/totals/nst-est2019-alldata.csv?#")
Now that we’ve got our data, via readr (for data reading) plus dplyr (for general excellence) and flextable (for displaying the results) let’s determine the top 8 US states by population in 2019 and print up a nice table. I’ll be seeding the meet in order of population, with the most populous state getting the top seed.
seeds <- pop_data %>%
  mutate(STATE = as.numeric(STATE)) %>%
  filter(STATE >= 1) %>%
  select(NAME, POPESTIMATE2019) %>%
  arrange(desc(POPESTIMATE2019)) %>%
  top_n(8) %>%
  mutate(Seed = 1:n(),
         POPESTIMATE2019 = round(POPESTIMATE2019 / 1000000, 2)) %>%
  select(Seed, "State" = NAME, "Population (mil)" = POPESTIMATE2019)

seeds %>%
  flextable() %>%
  bold(part = "header") %>%
  bg(bg = "#D3D3D3", part = "header")
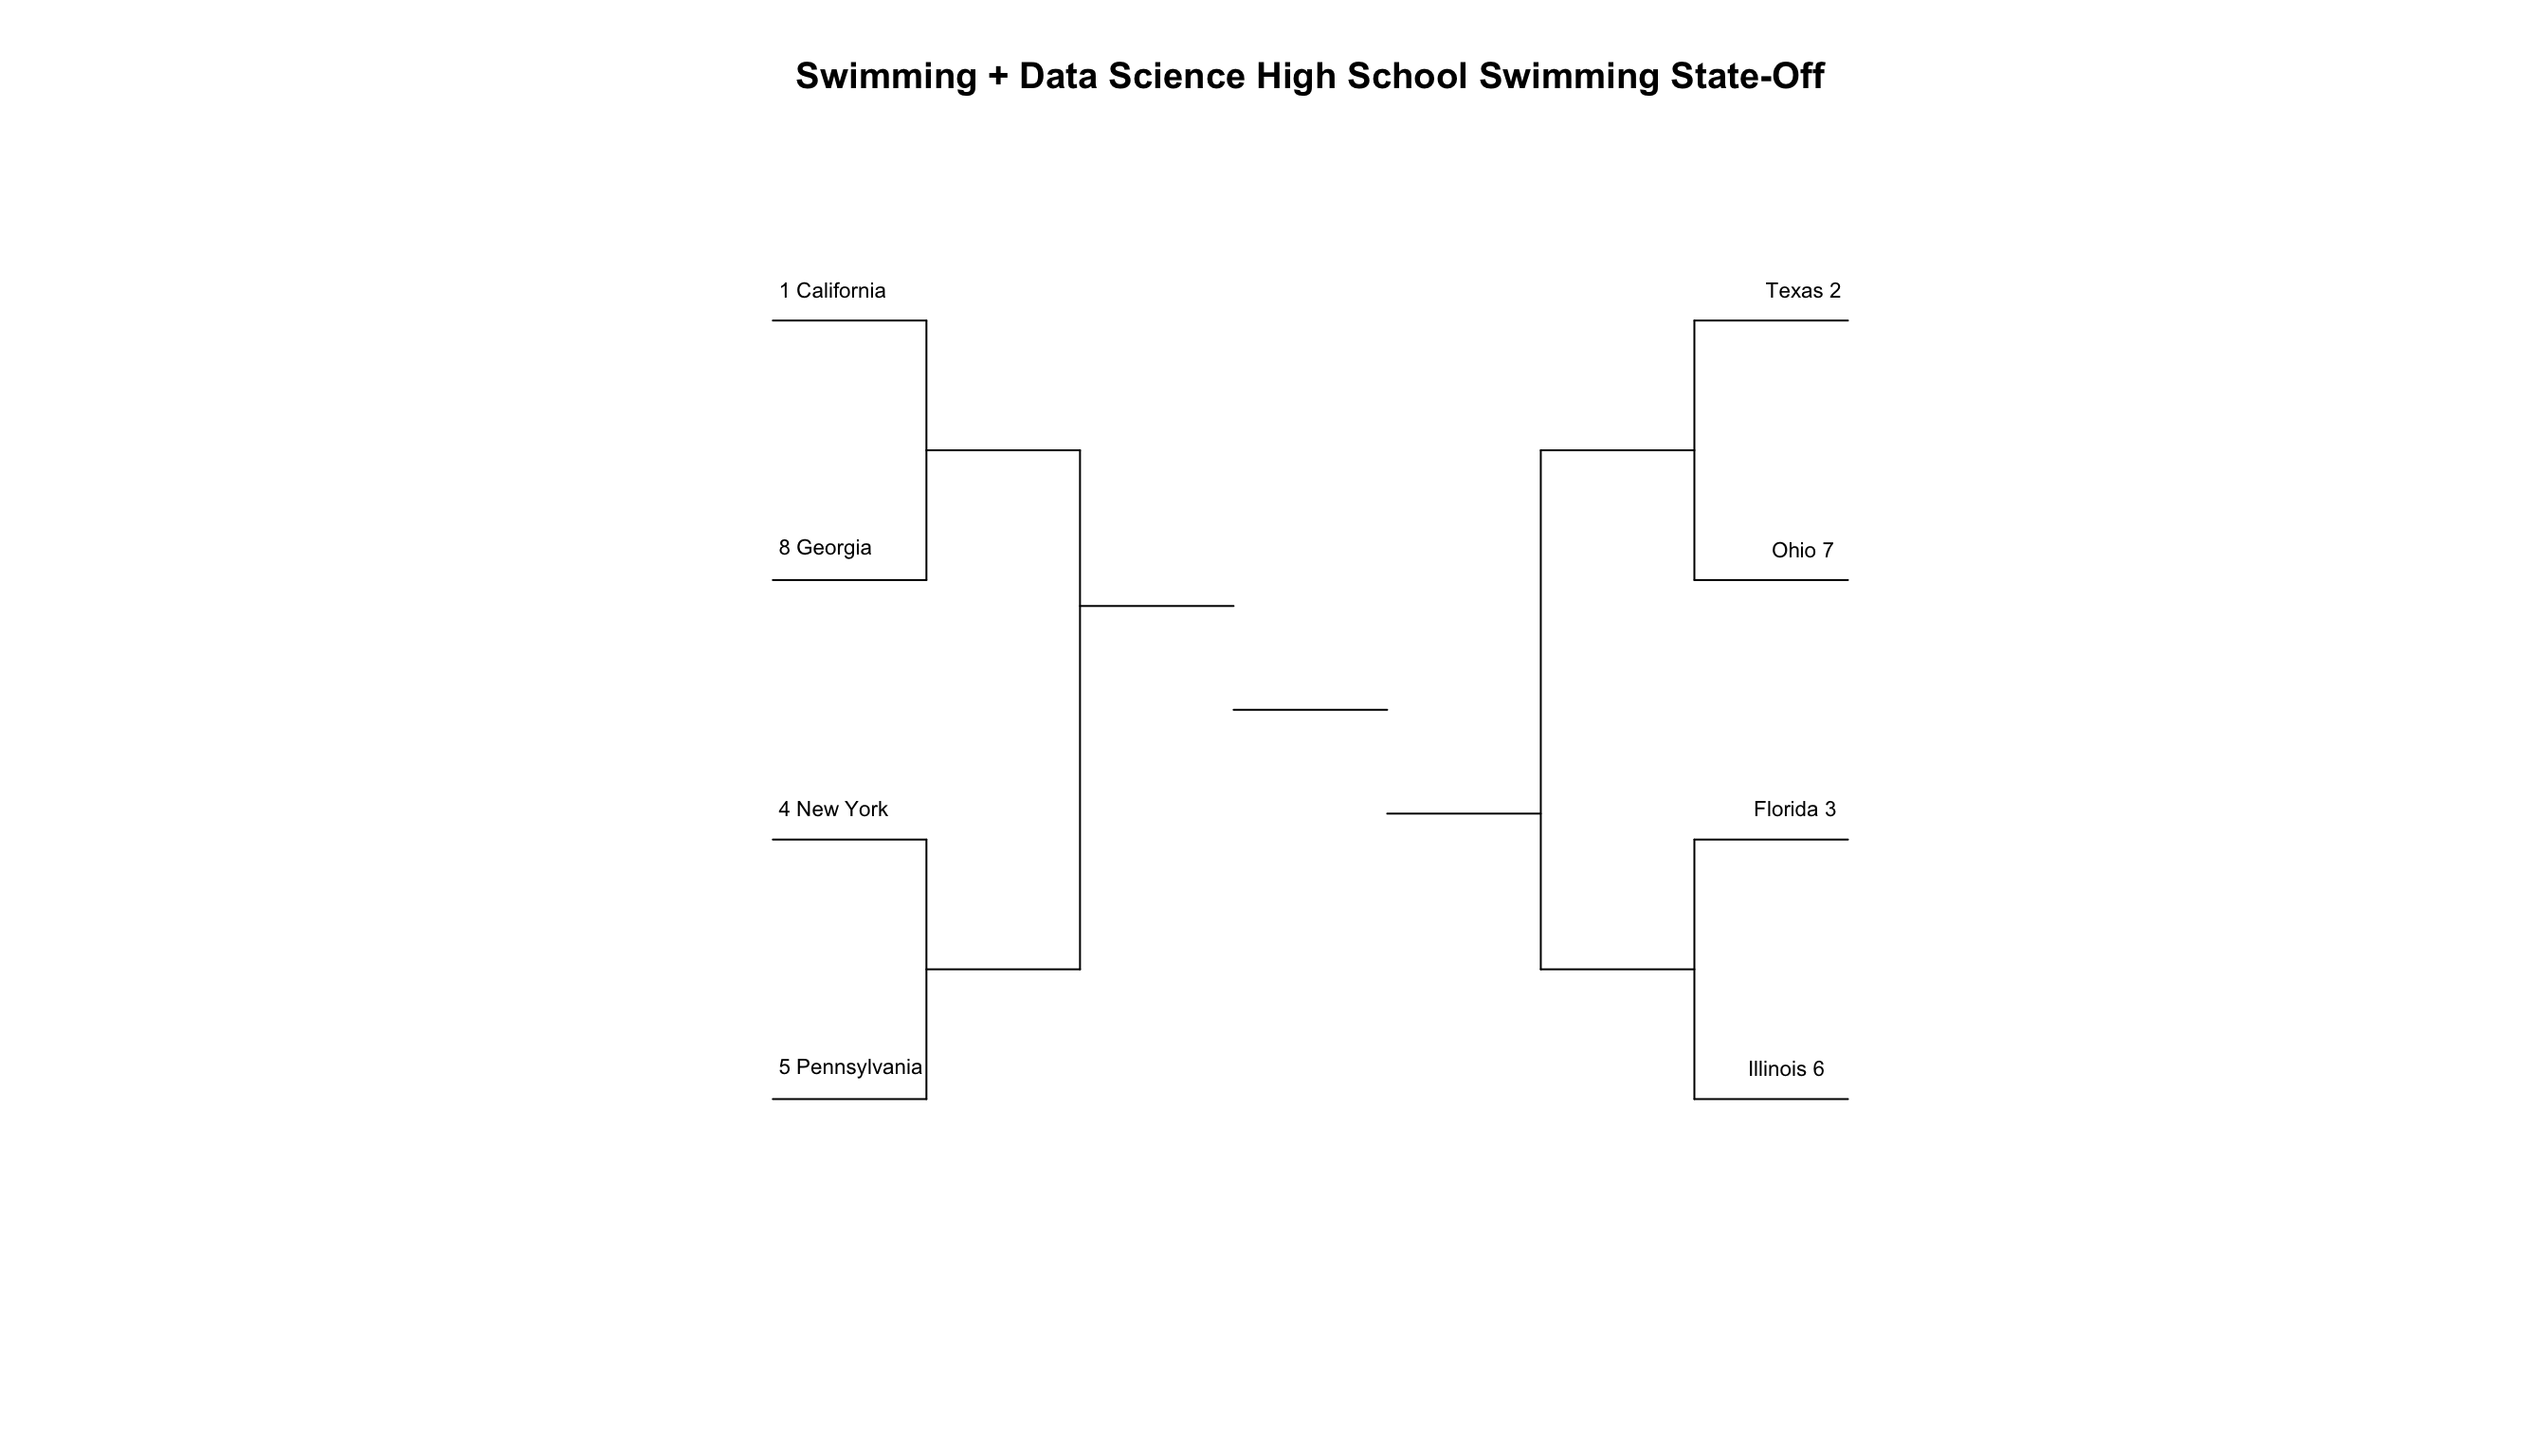
Okay, so California, Texas, Florida, New York, Pennsylvania, Illinois, Ohio, and Georgia in that order. Now we just need to actually make a bracket. SwimmeR now has the draw_bracket function, which can produce brackets for anywhere from 5 to 64 teams. It’s just the ticket. Let’s see our match-ups!
library(SwimmeR)
draw_bracket(teams = seeds$State,
             title = "Swimming + Data Science High School Swimming State-Off",
             text_size = 0.7)
The next several posts will cover each match-up in depth, dealing with getting and cleaning the meet results, scoring out the meet for boys, girls and combined, and discussions of the process, until a State-Off champion is crowned. Additionally I’ll do a wrap up post where I run the meet as one giant invitational, name swimmers of the meet and comment on anything interesting I find.
Since New York vs. Pennsylvania is one of the most hotly contested match-ups amongst my old teammates it’ll be the next post. Stay tuned!
Updated: 20 April, 2021
Created: 16 July, 2020
