Where Are All The 10s - Diving Math
Welcome to another case study here at Swimming + Data Science. We’re returning the world of diving, a place we’ve visited before, in an attempt to answer the question “where are all the 10s?” Today’s data science component will consist of matching calculated values to sets of allowed solutions, plus some tidyverse style data wrangling and plotting with ggplot2.
Over the past decade I’ve judged a fair bit of high school and college diving. I’ve never given a 10. I’ve never even seen anyone give a 10. Heck I’ve only given a total of two 9s. What gives? Where are all the 10s?
Introduction to Diving Scores
library(dplyr)
library(purrr)
library(tidyr)
library(ggplot2)
For those of you, like me, whose background isn’t in diving let’s start out with a bit on how diving point totals are calculated. There are a finite number of dives, each of which has an assigned degree of difficulty (DD). When a diver performs a particular dive the performance is judged by a panel of (usually) 3, 5, or 7 judges, who each score the dive between 0 and 10, in increments of 0.5 points. If there are 5 or 7 judges than the highest and lowest, or two highest and lowest scores are thrown out, leaving the three in middle. The three remaining judges’ scores, called awards, are then added together and that number is multiplied by the degree of difficultly to get the total points for that particular dive.
For this discussion we’re going to sometimes drop the “three judges” component, and talk rather about an average judges’ score. This will make things easier later, but right now there’s a bit of complexity. Since judges can only award their scores in increments of 0.5 between 0 and 10 the average score can’t be just any number between 0 and 10. In fact there are only 61 possible average judges’ awards. We need a list of those possibilities.
vec <- seq(0, 30, 0.5) # every possible total score, from all three judges giving 0s to all three judges giving 10s

decimals <- unique((vec %% 3)/3) # possible decimal components for the average score
integers <- seq(0, 10, 1) # possible integer components for the average score

l <- unlist(lapply(integers, decimals, FUN = function(x, y) {x + y})) # add all of the possible decimals to all of the possible integers
Possible_Avg_Awards <- l[l <= 10] # only want values less than or equal to 10 (the max possible score)
We also need a list of each dive and its degree of difficulty. FINA, the international governing body for diving (and swimming) publishes such a list. I’ve formatted it for our use, and hosted it on github.
Our first step is to read the dives and DDs into R. For this study we’ll be working with “forward” dives, that is dives done using a forward approach and involving a number of half somersaults (flips). Each dive has a number in addition to an equivalent name. The numbers for forward dives are three digits long and always begins with a “1” The second digit is either a “0”, for standard forward dives, or a “1”, for “flying” dives. We’re only going to look at standard forward dives, so our first two digits will be “10”. The last digit encodes the number of half somersaults the dive entails. So a third digit of “1” means forward dive, standard, one-half somersault. A half somersault means the diver, who begins standing upright, will flip 180 degrees, and enter the water head first. Similarly in a “102” dive the diver will begin standing upright, do two half somersaults (i.e. one full somersault), for a total flip of 360 degrees, entering the water feet first. There’s a progression here, “10X” series dives become more difficult, and have higher DDs as “X” increments from 1 to a maximum of “9”, requiring more half somersaults. We’ll also restrict ourselves to dives in the “tuck” position for the sake of consistent comparisons across dives.
DDs_Link <- "https://raw.githubusercontent.com/gpilgrim2670/Pilgrim_Data/master/Diving_DDs.csv"
Forward_DDs <- read.csv(url(DDs_Link)) %>%
  filter(Number <= 109, # only forward dives, no twists, no flying position
         Board == "1m") %>%  # only looking at dives from a 1 meter high springboard
  select(Number, Name, "DD" = C) # only want dives in the "C" - that is "tuck" position
Calculating Possible Scores for Each Dive
Now that we have the dives and DDs, we’d like to know what scores are possible for each dive. For each dive we’ll multiply the DD by each of the possible average awards to get a list of possible scores for each dive. We’ll collect those lists together into a data frame containing the average judges’ award, the DD, the and the corresponding score for each dive.
# here's we'll get a list of nine lists.  Each list is all the possible scores for a specific dive
Scores_List <- map(Forward_DDs$DD, function(x, y) {x * Possible_Avg_Awards * 3})

# name each list with the dive number it corresponds to
names(Scores_List) <- Forward_DDs$Number

Scores_List <- Scores_List %>%
  bind_rows() %>% #stick the lists together
  bind_cols(Possible_Avg_Awards) %>% # add a column containing the list of possible average judge's awards
  pivot_longer(names_to = "Number",
               cols = starts_with("1"),
               values_to = "Total_Score") %>% # go from wide to long format by creating a new column called
  # number containing each dive number, and a new column called Total_Score containing each possible score
  rename(Award = "...10") %>% # rename our average judge award column to something sensible
  mutate(Number = as.numeric(Number)) # will need dive number as a number later
Embedded in Scores_List is the maximum possible score for each dive. We’d like to make this information available in a tidy way since we’ll be relying on various tidyverse packages like ggplot2 for visualization later. Similarly we want the maximum dive of the previous dive in the series as well, so we can look at moving up/down in the dive series.
Scores_List <- Forward_DDs %>%
  mutate(Max_Award = DD * 30, # maximum possible score is the DD times 3 10s
         Prev_Max = lag(Max_Award)) %>%  # maximum possible score for the previous dive in the forward series
  right_join(Scores_List) %>%  # attach data frame of all possible scores
  mutate(Name = factor(Name, levels = unique(Forward_DDs$Name)), # make Name a factor so we can order it on plots
         Dive_Label = paste0(as.character(Number), "C: ", Name)) # combines dive name and number
If we compare for example the maximum possible points for a 101C, (36) and then look at the next dive in the series, a 102C which has a DD of 1.4 we can determine what judges’ award would be needed on a 102C to score more than the maximum possible score on a 101C. That number is the max score for a 101C, divided by the DD for a 102C, divided by 3 (for the three judges), so 36, divided by 1.4 divided by 3, which is 8.57. However, 8.57 isn’t actually possible as an average judges’ score. It’s not on our Possible_Avg_Awards list. So we need a way to go from our computed number to the nearest, higher possible score.
Award_Match <- function(x, D_D = DD, Pos = Possible_Avg_Awards) {
  Pos[base::findInterval(x / (D_D) / 3, Pos) + 1] # matches the next highest element of Possible_Avg_Awards, by adding one to the match
}
So the actual possible combination of judges awards that makes a 102C worth more points than are possible to score when diving a 101C is 8.67.
Possible Points for Each Dive
There’s a linear relationship between judges’ award and possible score for each dive, dictated by that dive’s DD, which is the slope of each line in the plot below.
Scores_List %>%
  ggplot() +
  geom_line(aes(
    x = Award,
    y = Total_Score,
    color = as.factor(Dive_Label), # naturally ordered by the numeric portion 101, 102 etc.
    group = as.factor(Dive_Label)
  )) +
  scale_x_continuous(breaks = seq(0, 10 , 1)) +
  scale_y_continuous(breaks = seq(0, 150 , 25)) +
  labs(color = "Dive",
       y = "Total Score") +
  theme_bw()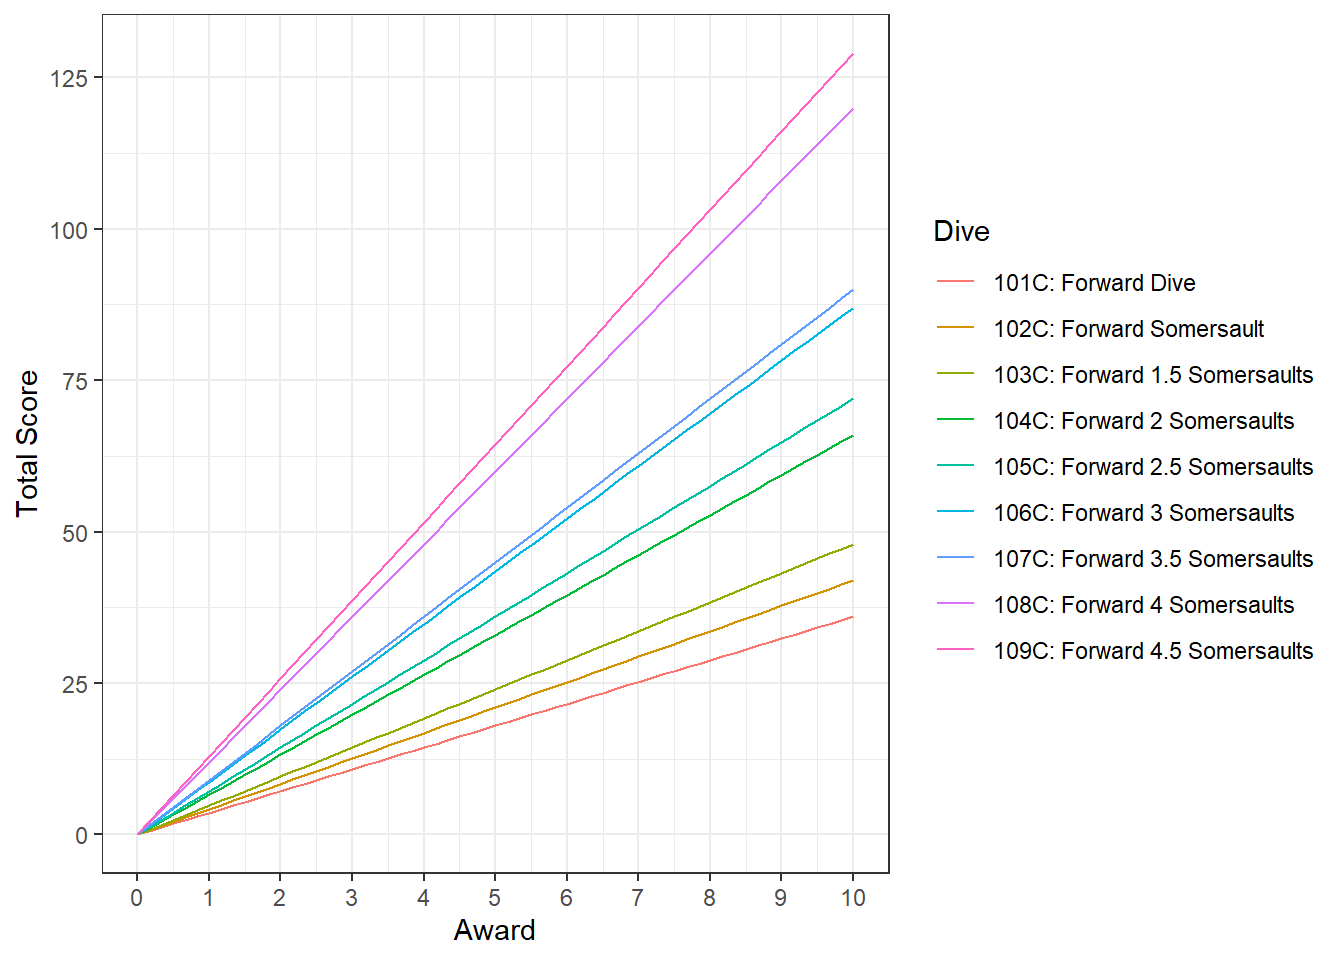
Since judges’ awards are limited to a maximum of 10 (total 30), each dive then has a maximum possible score. For a diver to improve their total score it eventually becomes necessary to perform a harder dive, with a correspondingly higher DD, and higher maximum score. Where exactly are these crossover points though?
Crossover Points
As we saw for the 101C/102C case above there’s a point, corresponding to a possible combination of judges’ awards, for each pair of dives where the dive with the higher DD becomes mathematically more valuable in terms of points scored than the lower DD dive. We’ll plot that point of strict mathematical superiority for each neighbor-pair of dives in the forward dive series. That means 101C and 102C are a pair, 102C and 103C, 103C and 104C etc.
Scores_List %>%
  ggplot() +
  geom_line(aes(x = Award,
                y = Total_Score,
                group = Number)) +
  geom_segment(aes(
    x = 0,
    xend = Award_Match(Prev_Max, DD, Possible_Avg_Awards),
    y = Award_Match(Prev_Max, DD, Possible_Avg_Awards) * 3 * DD,
    yend = Award_Match(Prev_Max, DD, Possible_Avg_Awards) * 3 * DD
  ),
  color = "blue") +
  geom_segment(aes(
    x = Award_Match(Prev_Max, DD, Possible_Avg_Awards),
    xend = Award_Match(Prev_Max, DD, Possible_Avg_Awards),
    y = 0,
    yend = Award_Match(Prev_Max, DD, Possible_Avg_Awards) * 3 * DD
  ),
  color = "blue") +
  geom_point(aes(
    x = Award_Match(Prev_Max, DD, Possible_Avg_Awards),
    y = Award_Match(Prev_Max, DD, Possible_Avg_Awards) * 3 * DD
  ),
  color = "blue",
  alpha = 0.5) +
  scale_x_continuous(breaks = seq(0, 10 , 1)) +
  scale_y_continuous(breaks = seq(0, 150 , 25)) +
  facet_wrap(. ~ Dive_Label) +
  labs(y = "Total Score") +
  theme_bw()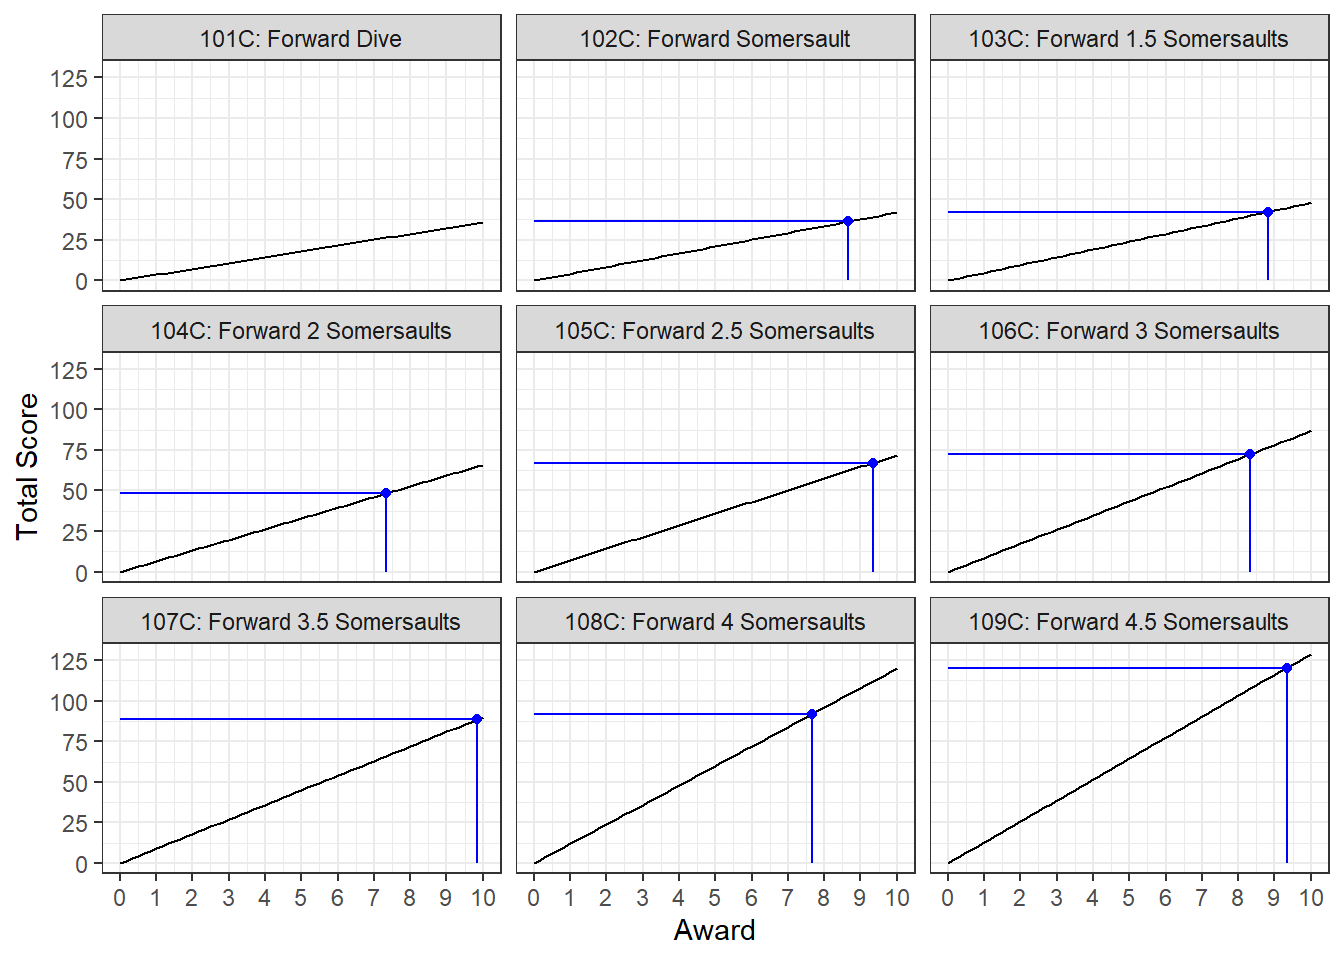
Each point on the plot above is the score a diver must achieve on a given dive to score mathematically more points on that dive than would be possible on the previous dive. The 101C doesn’t have a point drawn because there is not a previous dive to compare to - it’s the first dive. Let’s pull out just these points.
Scores_List %>%
  group_by(Name) %>%
  mutate(
    Slope = lm(Award ~ (Total_Score))$coefficients[2],
    Award_Cross = Award_Match(Prev_Max, DD, Possible_Avg_Awards)
  ) %>%
  summarise(Award_Cross = unique(Award_Cross)) %>%
  ggplot() +
  geom_point(aes(x = Name, y = Award_Cross)) +
  scale_x_discrete(labels = unique(Scores_List$Dive_Label)) +
  scale_y_continuous(breaks = seq(7, 10.5, 0.5)) +
  coord_cartesian(ylim = c(7, 10)) +
  theme_bw() +
  theme(axis.text.x = element_text(angle = 45, hjust = 1)) +
  labs(y = "Judge's Award Crossing Point",
       x = "Dive")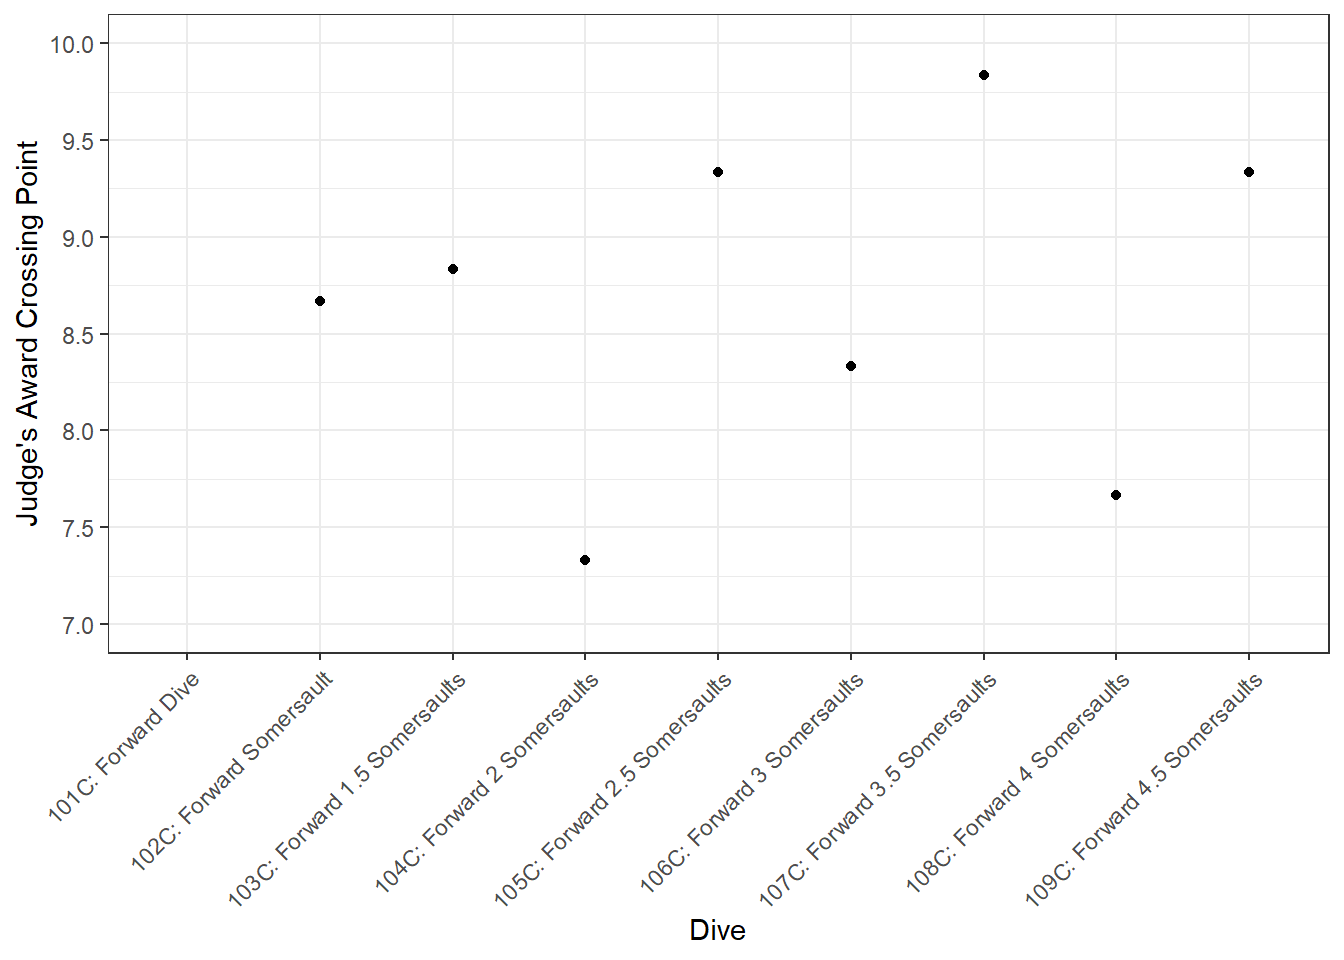
We can see that FINA believes going from an odd number of half somersaults (10X, X is odd) to an even number is harder than going even to odd, because the strict points for switching to even dive numbers are much lower than the strict points for switching to odd dive numbers.
Changing Dives
Here’s the thing though - most divers don’t expect (or deserve) 10s on the dives they do. That might sound unfair coming from an official, but consider the case of a hypothetical diver, Riley Ripit. Let’s say Riley can do a 101C for 10s, scoring a total of 36 points. She goes to a meet, dives as planned, gets her 10s and her 36 points. Great! The next week she goes to another meet and dives even better. Her height off the board is higher, her rotation in the air is faster, her entry is perfect, she’s on fire! She still gets 10s though, because that’s the maximum possible award. She has no upside risk in her dive. Of course if she goes to a third meet and has a bad day, she can get lower than 10s, much lower even. That’s to say she has a lot of downside risk. This is a bad situation to be in. What she wants is to do a harder dive, with an approximately equivalent expected score (36 points), but with some upside risk, so if she dives better than expected she can score more points. Also if she dives poorly she won’t fall as low, meaning less downside risk. A similar argument is possible with 9.5s. If Riley expects 9.5s, and dives well she can only get a little award bump, up to 10s. Ideally she’d plan her dives to have upside risk and minimal downside risk, although exactly how much she wants of either is between her and her coach. This is the answer to today’s overall question about the lack of 10s though - we don’t see many 10s in diving competitions because it doesn’t make sense from the diver’s side to aim for 10s. Still, it’s a dream of mine to one day award some deserving diver a 10.
It would be useful to know, given a dive done for a particular average judges’ award, what award a new dive would need to be done for to make a switch worth considering. Let’s make a function to do that.
dive_calc <- function(current_dive, new_dive, current_award, FDDs = Forward_DDs, Pos = Possible_Avg_Awards){
  # given an incumbent dive and an incumbent average score, what average score would be required on a given new dive to get at least the same total number of points
  current_DD <- FDDs[FDDs$Number == current_dive, ]$DD # get DD on current dive
  new_DD <- FDDs[FDDs$Number == new_dive, ]$DD # get DD of new dive
  new_award <- (current_award * current_DD)/new_DD # calculate score where two dives are equivalent
  new_award_switch <- round(Pos[base::findInterval(new_award, Pos) + 1], 2) # convert score to possible award

  return(new_award_switch)
}
We can use our function to determine the equivalence point between a 103C done for 5.5s and a 104C.
round(dive_calc(current_dive = 103, new_dive = 104, current_award = 5.5, FDDs = Forward_DDs, Pos = Possible_Avg_Awards), 2)## [1] 4.17
Let’s also look a every possible switching point for a given pair of dives by mapping dive_calc across every possible judges’ award.
New_Dive <-
  unlist(map(Possible_Avg_Awards, dive_calc, current_dive = 103, new_dive = 104)) %>%
  bind_cols(Possible_Avg_Awards)

New_Dive %>%
  ggplot() +
  geom_point(aes(x = `...2`,
                 y = `...1`)) +
  scale_x_continuous(breaks = seq(0,10,1)) +
  scale_y_continuous(breaks = seq(0,10,1)) +
  labs(x = "Current Dive Award",
      y = "New Dive Award to Switch") +
  theme_bw()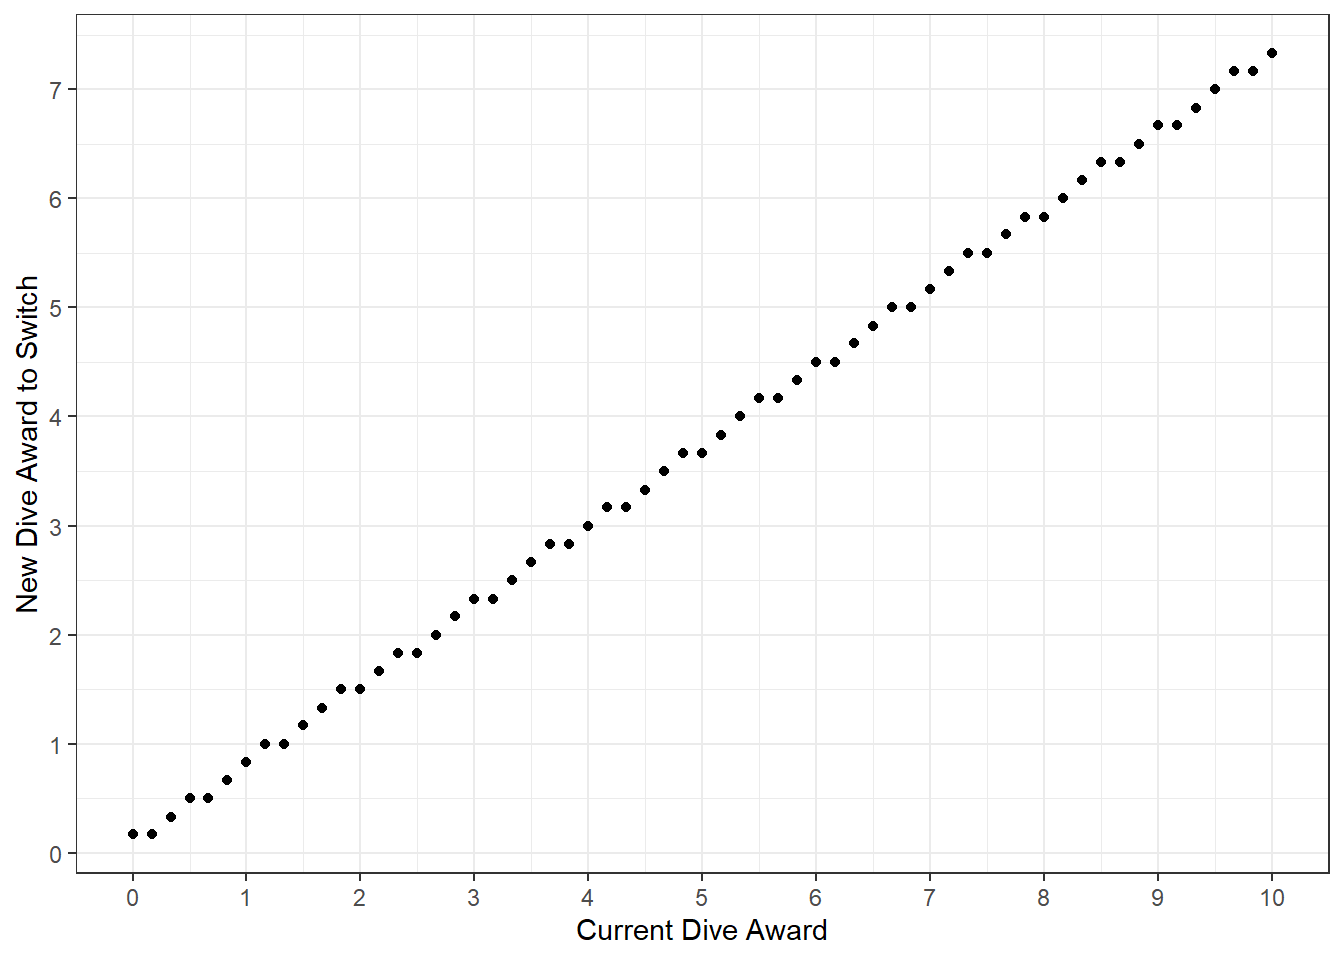
The plot isn’t exactly linear, because not every score is available, due to the limited set of possible judges’ awards.
Conclusions
We answered our initial question about the dearth of 10s in diving competitions by examining upside risk from the diver’s perspective. Going into a competition expecting 10s doesn’t leave any upside risk, so unless a diver can do the most difficult dives available perfectly (like in the Olympics) doing more difficult, higher DD dives for lower expected judges’ awards makes more sense than aiming for 10s on easier dives.
More mathematically we’ve seen two reasons why a diver might change their dive. The first, strict mathematical superiority, is an absolutely iron clad reason, but it’s quite rare in practice. The second, a desire for more upside risk, dominates in real life. That said, learning a new dive isn’t trivial, and it’s possible that for a particular diver/dive it might be wiser to improve an existing dive rather than attempt to learn a new one. I’m not a diving coach and I don’t know how to weigh those two options. If you are a diving coach or have some theories, write in or leave a comment and maybe that will be the focus of another post here at Swimming (and also diving) + Data Science.
Updated: 18 November, 2021
Created: 1 October, 2020